


Table of Contents
Welcome, everyone! I’m Drifter, back with a how-to guide on an edge that many pro players already use to up their game. The main use of a hypergeometric calculator in Magic is for calculating probabilities. Probability is crucial in determining and affecting the outcome of magic games; the vast majority of games come down to the specific cards you draw and that is entirely based on probability – both in deckbuilding and in draws. Hypergeometric calculators let you calculate the odds and apply them in both areas.
The first and most obvious benefit is in mana base construction – you can mathematically assess and adjust any mana base by calculating hypergeometric distribution; you can see exactly how much benefit there is in adding that extra Swamp or Overgrown Tomb to your Sultai deck, and how much damage there is in removing an Island to make room for that. You can check precisely how many lands your deck needs, if your curve stops at 5 mana, but you really need to hit that 5th mana on time. The Frank Karsten mana base isn’t a dream; it’s a very achievable goal, with some practice and a hypergeometric calculator. This guide will go over all the basic calculations, and show you how to check your existing decks. As comes with the territory, it’ll also be chock full of mana base construction advice!
The possibilities are endless: every deck can benefit from a look under the microscope and an assessment of whether your numbers are in the right places. I’m going to teach you in this article how to learn the baseline %s you should strive for to have a consistent mana base based on the tenets behind good mana base construction, and how to apply those %s to real life decks and situations.
I’m also going to show you how to make better use of known information: to use percents to influence your keep/mulligan decisions, to know whether it’s worth topping that really important card even though it might mana screw you, and to play better and win more games as a result. It’s all about establishing baselines – once you know the chances of drawing a land with a two land opener by turn 2 with 24 lands so you can cast your 3 drops, you don’t need to do the calculation anymore and you now have a rough idea for 23 or 25 lands.
This is not a very technical article: using hypergeometric calculators is simple and easy once you know how, and it’s not hard to learn at all. I’ll be guiding you through a bunch of examples, and you’ll pick it up naturally as we go. If you know what percents are, well done! You’re qualified.
So first, how do I actually use one of these things?
For the purposes of this article, I’ll be using the hypergeometric calculator at https://stattrek.com/online-calculator/hypergeometric.aspx, but any of them will work.
So first off, this or something very similar is the box that should greet you:
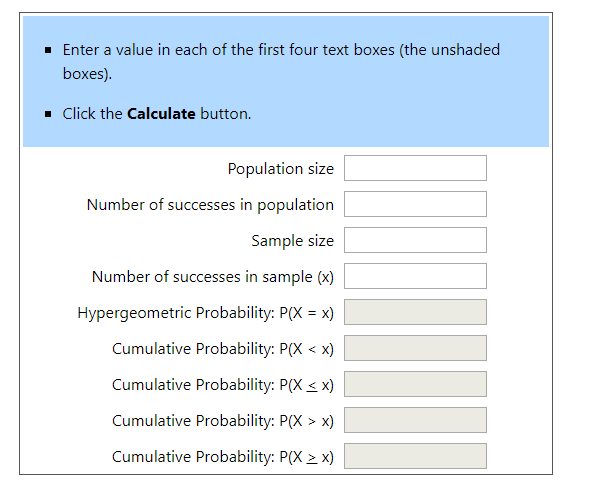
Some magic-specific hypergeometric calculators, like the one at https://aetherhub.com/Apps/HyperGeometric will name the headings something different to help you, but this is the barebones and I’ll be explaining what it all means anyway. Let’s go over a mana base construction example first. What are our chances of having double red, if we have cards that require that, on turn 3 in our 20 red source Standard deck?
Population size: this is the pool of cards you’re drawing from, so 60 cards in most constructed formats, 40 in limited and 99 in Commander (since you exclude the Commander itself). Enter whichever you need, 60 for this example.
Number of successes in population: this is the number of ‘hits’ in your deck – the total number of cards you’re looking to draw in the overall pool. For calculating chances of having double red on turn 3, that means we’re looking at red sources and we have 20.
Sample size: this is the number of cards we’re drawing, within which we have to find those hits. So we’re looking at turn 3 – how many draws have we taken before turn 3? Well, you don’t draw on the first turn when you’re on the play, so clearly it differs. On the draw, you draw 7 cards for your opening hand and then have 3 draw steps = 10 cards, and play is always 1 less than that. The London Mulligan doesn’t actually reduce the number of cards we’re looking at, so we don’t have to account for that at all – if we’re aiming to cast a double red card like Chandra on turn 3, we really don’t want to be bottoming our second red source anyway. So, we need to do two separate calculations and average them to account for play/draw – one for 9 draws, and one for 10. All the other variables remain the same, so this is super easy to do.
Number of successes in sample – this is the number of cards we want that we’re hoping to draw. We need 2 red sources on turn 3 to cast Chandra, so we enter 2 in this example. I will refer to this as X, since that’s the X in all the calculations.

This is what happens when we put it all together. This is the first of the two calculations – this one is for being on the play. Now, we have five outputs here but the important one for this example is the one at the bottom – Cumulative Probability: P(X ≥ 2). This is referring to the % chance of drawing 2 or more red sources, since if we draw more than 2 then that’s fine too – we can still cast Chandra. That means our % to have double red on turn 3 is 87.7% on the play. We still need to do the second calculation for on the draw; I went ahead and did this one and it came out to 91.6%. If we average those two (add them together and divide by 2), it comes out to 89.7% – so we have about a 90% chance to have the double red to cast Chandra on turn 3.
This is a pretty good percent to aim for, for most of your mana base needs – going too far above this might either hurt other sources or require playing more lands. Sometimes you’ll naturally be well over 90 on all your sources, and that indicates your mana base is exceptionally good – at that point, you can think about trimming a tapland or something, so you can deploy your threats faster. A 10% failcase is fine – that means for the vast majority of your games, you will have double red on turn 3, and each source you add to increase it past 90% will have diminishing returns.
Deciding how many mana sources to run is an incredibly important calculation in any deck, which hypergeometrics can help you with also – let’s look at calculating your chances to have 3 lands on turn 3.
We need to know how many mana sources we’re running for this, let’s define that for a sec. Mana sources are mostly lands, but can include other things – say we had 4 Paradise Druid: that would also be a source for a turn 3 play like Chandra, since we can just choose to play the Druid on turn 2 so if we had 24 lands + 4 Paradise Druid, that would be 28 mana sources (Paradise Druid would also be a red source if we had it). There’s some chance our Druid dies, so it’s not as consistent a source as a land, but Paradise Druid is at least pretty hard to kill, so it’s a fairly consistent source.
You should still count cards like Incubation Druid as coloured sources, but perhaps don’t count them as a full mana source, because they can die. The more vulnerable they are to being killed, the more we need to adjust and I would estimate that Incubation Druid dies about half the time you play it, so we just count it as 2 mana sources instead of 4 if that’s the case. If we don’t have a strong idea of how likely Incubation Druid is to die, we can just aim for a slightly higher overall % – maybe we want 93% to cast a 3 drop on turn 3 with Incubation and still just 90 with Paradise.
If a card like Angrath’s Rampage is heavily played, it is worth noting that Paradise Druid suffers as a mana source a bit – since now there is a common and easy way to kill it.
Anyway, back to the example – say we have 24 lands in this deck, and no other mana sources.

I’ve gone ahead and entered everything but let me explain briefly – the population size is still 60 as we still have 60 cards in deck. The number of successes in population is now 24 – the number of mana sources we have. The sample size is 10 on the draw then 9 on the play, because we’re still looking at turn 3. We want to draw three lands, so X=3.
So, we have an 85.6% chance to have three lands on turn 3 on the draw, and then we’re drawing one less card on the play again, so sample size = 9 for the play calculation. I’ve gone ahead and done that and that’s 78.9%. The average is 82.3% so we’re about 82% to have 3 lands on turn 3 with 24 mana sources.
The advantage of all this is that using this method, you can construct whatever mana bases you want, as long as you have an idea of the %s you’re aiming for. You can look at any pro deck you want, and see what kind of mana base %s they have, and use those as goals if you would like.
Realistically in a game of magic, you don’t always need to cast things on time. You can often afford to wait a turn on Chandra, if you have other stuff you can cast instead. Generally the numbers for aggro decks will be a bit lower, since they can’t use lands well in the late game so preventing flood is paramount, and that’s why they run fewer lands. However, aggro decks also work far better off just a few lands than a deck with expensive spells, and so it’s okay that they can’t cast Chandra on turn 3 all the time – if a midrange deck can’t cast Chandra on turn 3, they might well not have other spells that cost less than 3, but an aggro deck is filled with these. It’s more important for slower decks to have good %s on this stuff, and therefore to run more lands.
Just knowing the percents and getting a feel for them will aid you immeasurably in future deck construction – if you play a bunch of games with any deck, you’ll come to realise that 75% to have the mana requirements for this one important spell just isn’t good enough and you need to raise the bar, and that will apply to tons of future mana base configurations. It’s just about knowing which of your cards are most important, which you need to cast the most on time, and therefore which you really need to prioritise. Also consider your curve – a deck with important 4 drops and a large number of them, like those with Fires of Invention, really wants to have 4 mana on turn 4 so that’s the point of the curve you want to be doing the most calculations for.
Worthy of note is that these percents are lower than those you have in actual play – because you can mulligan the really bad hands. Obviously, you don’t want to mulligan so you still want to aim for good %s, but the failcase is not as bad as the numbers might indicate – you don’t need to stress that much over only having 85 rather than 90%, for example.
So how do I use this information when playing magic rather than deckbuilding?
The most common way to apply this to games of magic is in keep/mull decisions. Clearly, this is a lot easier to do when you’re playing online – you won’t be allowed to crack out a hypergeometric calculator on your phone at a paper tournament. But you can get around this – pro Matt Sperling talks in this video (https://youtu.be/2eNWESTTgL4?t=455) about how he often cracks out the hypergeometric and goes over common keep/mull scenarios, and how helpful the maths is for basing his decisions. This is a very common thing for pro players to do and if you do it enough times, you just remember them naturally – Sperling talks about how he has established a baseline of %s in his mind so he can apply them quickly and easily to keep/mull scenarios. If you visit pro player streams often, you’ll notice plenty of them crack out the calculator on occasion, when they don’t have a specific % memorised!

For example, I know that I have a 40% chance to draw at least one copy of a 4-of card in my opening hand in any 60-card deck, and that the chance of me drawing one rises by about 4% per draw step, if I haven’t already drawn one. That means if there’s a really important 4-drop like Fires of Invention in my deck I need to draw, I know I’m about 56% to draw it in four draw steps after my opening hand (so t4 on the draw). If I have a card like Shimmer of Possibility, that gives me access to three extra cards so my % rises to 68% (4×3=12+56=68%).
That’s the theoretical angle I know before the game, but I can also calculate my chances with my opening hand. This is the calculation for drawing Fires by turn 4 on the draw if my opening hand doesn’t have it, and I don’t have Shimmer or any way to look at extra cards:

So in this example, there are 53 cards remaining in my deck, because I already drew 7 for my opening hand. The number of successes is 4 since 4 Fires of Invention. I have 4 draws on the draw (and 3 on the play) towards Fires and I just need 1 so X=1. I get 27.6% on the draw, and 21.4% on the play so I’m only likely to draw Fires in that spot in roughly 1 in 3.5 games on the draw, and 1 in 5 on the play (now that we’re in a game and know which one, we don’t need to average). This means that without being able to look at extra cards, I’m pretty unlikely to draw Fires in either case – so if my deck isn’t all that capable of winning without Fires and doesn’t have much draw manipulation (neither of these applies to actual Fires decks, this is just an example), I should almost always mulligan – mulliganning gives me a new 40% chance to find Fires.
If I have Shimmer of Possibility in my opening hand, however, I can raise the sample size above by 3 so 53/4/7 or 6 on the play/1. I am now 44.3%/39.1% to find Fires on play/draw, assuming my Shimmer doesn’t hit other draw manipulation to ‘keep going’. With these numbers, it’s pretty clear that if I have Shimmer and my hand is reasonable apart from not having Fires, I probably should not try to mull to Fires, even if my deck can’t win without it – my chance of drawing it is lower on the draw with a new hand, and about the same on the play, but I’m just a card down.
The effects of play/draw and draw manipulation
Draw manipulation usually means card draw or scries, but any way to look at extra cards impacts our %s. If we have cheap draw manipulation in our deck, our chances of drawing the cards we need improve dramatically and therefore the range of hands we can keep improves. We can see the effect a card like Opt has on our opener because if we have a two-land opener and are looking for a third land, Opt increases our sample size by 2, assuming we can cast it before turn three – we can bottom off the scry if we don’t see a land so that’s one more card we look at, and then we have the draw.
Let’s look at that scenario I just mentioned:

So first, here’s the calculation for our chances to draw a third land in our 24 land deck; as you can see, the numbers have changed quite a bit!
Population Size: Because we’ve seen our 7-card opener in this example, we subtract 7 from our population size as the opener is no longer part of the pool, so 60-7 = 53 remaining cards.
Number of successes in population: Our hand has two lands in it, so there are only 24-2 = 22 remaining in the pool.
Sample Size: We’re looking at on the play in this example (just remember to add 1 if you want to see draw), so we get 2 additional draw steps before turn 3.
Number of successes in sample: We’re just calculating for one more land, so 1.
As you can see, on the play, we’re 66.2% or roughly 2/3 to hit that third land, so we won’t hit in 1 in 3 games – those are reasonable odds, but really not the greatest. Keeping a two lander with no draw manipulation is usually a pretty serious gamble in a deck with only 24 because often it’s not just one land we’re looking for even. I’ll show a slightly different example later, where we’ll want to hit two lands by turn 4, and our chances of doing that are only 37%. On the draw, the chances rise to 80.8% for one land, and 55% for two, so this is much safer.
With Opt, we can raise the sample size by 2, as I explained before, so on the play the sample size becomes 4, and on the draw it becomes 5. If we run through the same calculation again, that gives us 89.3% on the play and 94.1% on the draw – we’re a full 23% higher on the play and 13% on the draw. That really is a dramatic difference on the play – two land keeps on the play are usually borderline, but Opt makes those immediately great.
It’s worth noting that Opt doesn’t always look at two cards; it won’t help us as much in finding two lands as one because if we find a land with the scry, we just keep it and so we’re still only looking at one card, and that’s a pretty common occurrence. I’d recommend factoring in Opt as more like +1.5 in sample size when looking for multiple cards.
There are tons of cards in magic that look at extra cards cheaply, and you can tailor the calculation to fit whichever you want. If you’re keeping a one-lander with Serum Visions and your hand hinges on drawing the second land, that looks at three cards – so you would do a calculation of 53/the number of lands in your deck/4 on the play or 5 on the draw/1, for example.
As mentioned before, another common keep/mull scenario is whether you should keep a two land opener with no extra draws if you really need to hit two lands to cast your 4 drops on time. Here are the parameters in a 24 mana source deck:


So here, we can really see how gigantic the difference between play and draw can be. We are more than 18% more likely to hit the two lands on the draw than on the play – we definitely can’t keep the opener on the play if our 4 drops are the main reason to keep the hand as we’re only going to hit in just over 1 in 3 games, and it’s a bit sketchy even on the draw but much more likely to be a keep.
Many of you likely knew that play/draw massively impacts the hands you can keep, but now you have maths to tell you why and to be able to see exactly how much – your intuition might’ve said this was a keep even on the play, but the maths clearly shows otherwise. Maths always trumps intuition – you need to rely on intuition in magic, but being able to check whether you’re actually right is a massive advantage. The next time you see a two land opener and need to hit two lands in three draw steps, you’ll know for sure that keeping is a bad idea, rather than just have the suspicion that it is or isn’t.
Closing Thoughts
I haven’t come anywhere close to going over all the applications of hypergeometric calculators in magic, but I’ve shown how useful they can be in a variety of examples; they’re really an incredible tool for both deck construction and play improvement. I hope I’ve shown that they’re not hard to use – the difficulty is really in figuring out what you need to calculate but my examples cover some common scenarios, and you can work out many others by extrapolating from those.
Thanks for reading! I’ll be around to answer questions or respond to any feedback you might have, as always.
Other Info
I write articles on quite the variety of subjects. Find all my articles and guides here: https://mtgazone.com/drifter. Feel free to subscribe to me on Reddit, if you want to be notified as my future articles come out – I post most of them there.
I do draft articles, and offer a draft coaching service! Message me on the discord, through reddit, or through the comments on this article if you’re interested.
The MTG Arena Zone discord: https://discord.gg/SPYMExR. Engage with your favourite arenazone content creators there, myself included!
Some peeks into the developing new Standard meta:
PS: Warning! Complex maths incoming! This is my answer to a Reddit comment asking me to explain how to calculate the overall chances of being able to cast Rhythm of the Wild on turn 3. Some of you might be able to understand and apply my answer:
So the calculation for Rhythm of the Wild is a bit complex… I’ll explain, but I’m afraid it’s not going to be an easy explanation. You cannot multiply if you are playing dual lands – you can only multiply independent probabilities and because you are playing 4 Stomping Ground, the chances aren’t independent of drawing red and green. Let’s say for simplicity’s sake that you’re playing a deck with 4 Grounds 10 Mountain 10 Forest. You have to try to account for the parts that are dependent, which we can do like so:
The Overall Sum = chance of drawing at least 3 lands = 85.6% – chance of drawing at least 3 mountains but no non-mountain lands – chance of drawing at least 3 forests but no non-forest lands.
So how do we calculate our chances of drawing at least 3 mountains/forests but no non-mountain/forest lands? Let’s take mountains – we need to first take the chances of drawing no non-mountain lands (a hypergeom calculation for 60/14/10/0 on the draw and take the first output = 5.4%) and multiply by the chance of drawing at least 3 mountains in the remaining 46 (46/10/10/3 = 37.2%) = 2%. The chance of drawing at least 3 forests but no non-forests will be the same as drawing 3 mountains but no non-mountains, since we have the same number of sources so:
85.6%-2%-2% = 81.6%. This is our chance to cast Rhythm of the Wild on turn 3 in the example above.
Premium >
Enjoy our content? Wish to support our work? Join our Premium community, get access to exclusive content, remove all advertisements, and more!
- No ads: Browse the entire website ad-free, both display and video.
- Exclusive Content: Instant access to all exclusive articles only for Premium members, at your fingertips.
- Support: All your contributions get directly reinvested into the website to increase your viewing experience!
- Discord: Join our Discord server, claim your Premium role and gain access to exclusive channels where you can learn in real time!
- Special offer: For a limited time, use coupon code L95WR9JOWV to get 50% off the Annual plan!


Drifter
Articles: 500More Articles

Best Standard Decks: Outlaws of Thunder Junction Meta Report – April 23, 2024

Outlaws of Thunder Junction Review: Best Cards for Timeless, Historic and Explorer

New Brews for Outlaws of Thunder Junction Standard and Alchemy

New Outlaws of Thunder Junction Standard Decks for Day 1

Top 5 New Timeless Decks for Outlaws of Thunder Junction Day 1

Top 5 New Historic Decks for Outlaws of Thunder Junction Day 1

Best Outlaws of Thunder Junction Cards for Standard and Alchemy

B/W Control Standard Bo1 Deck Guide

Timeless Meta Report – Best Decks for Timeless Metagame Challenge, New Metagame Changes & Show and Tell Discussion

Standard Meta Report – Best Decks April 2024 Week 1

Timeless Mono Black Necro Vampires Deck and Sideboard Guide

Two Brews for the Explorer Metagame Challenge

Explorer Meta Report – Best Decks Post-Murders at Karlov Manor

Alchemy Golgari Midrange Deck Guide

Best Alchemy Decks – Qualifier Play-In (Best of 1) – March 2024
